Fields And Plotting
This section explains how you can display results in the form of numeric or string values as well as plots.
Fields
A field is a special value you can insert into your document that can show a result. Fields are evaluated after an algorithm or model completes and can be placed anywhere within the document.
Note
You may see fields sometimes referred to as ‘’Value Fields’’.
Fields act much like special characters or images and can be placed in-line with text. You can insert a field by:
Selecting Insert | Field… from the menus.
Clicking on the Field button,
 , found on the Insert
Dock.
, found on the Insert
Dock.Using the ‘’\vf’’ backslash command.
When you insert a field, Aion will display the Insert Field dialog, shown in Figure 91.
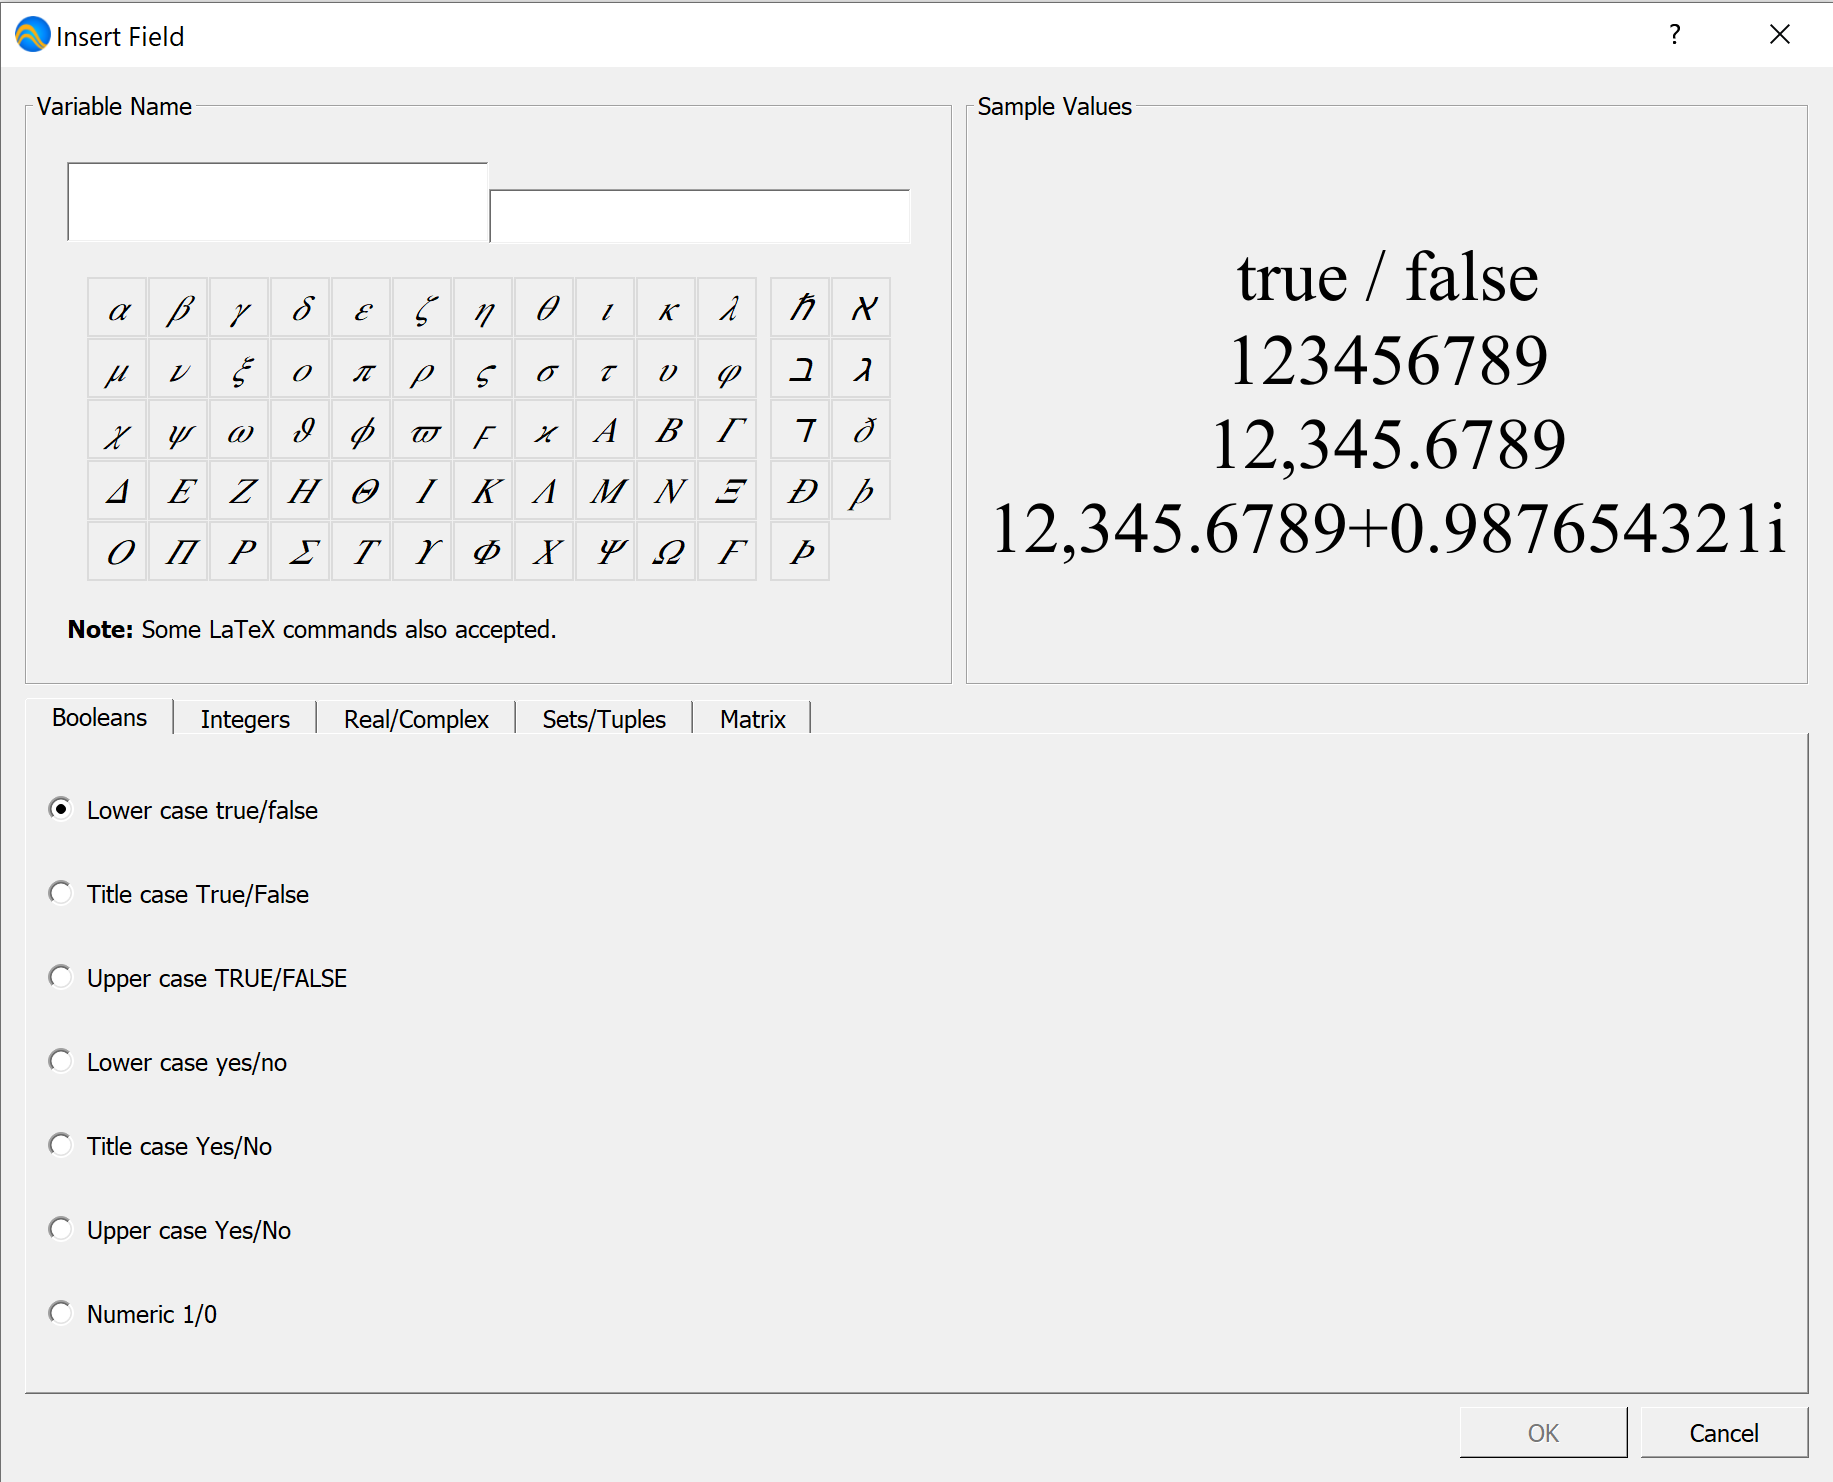
Figure 91 The Insert Field Dialog
Fields are very flexible and can display any of the supported data types.
Once a field has been inserted, you can modify the appearance of fields using the Format Field dialog. The format field dialog is virtually identical to the Insert Field dialog. To modify the appearance of a field, place the cursor on the field and select the Format | Field… menu option.
You can also adjust the appearance of fields using the Field Dock shown in Figure 72 although the Field Dock is less capable than the Format Field dialog.
You can use the Variable Name box to enter the name of the variable to be displayed in the field. The line edit fields are used for each portion of the variable name. Currently Aion can not display individual values from complex types such as sets and matrices. For your convenience, you can use the buttons in the Variable Name box to easily insert greek and special characters used in variable names. You can also use some backslash or LaTeX commands when entering variable names. The Insert Field dialog will change the command to the correct character as they’re entered and recognized by Aion. Note that all LaTeX and backslash commands must start with a backslash character.
You can use the ‘Sample Values’ box to preview how several different types of values would be displayed based on the current setting.
The Insert Field dialog contains a tab with the settings for each type of value that can be displayed in a field. Complex types such as sets and matrices will use the settings from multiple tabs. As an example, for sets, the Sets/Tuples tab will control the overall appearance of the set (and subsets, etc.) while the Matrix tab would control the appearance of matrices. The Booleans, Integers, and Real/Complex tabs would control the appearance of booleans, integer, real numbers, and complex numbers respectively.
Note
Rendering fields containing hundreds of members can be very time consuming. Aion may pause editing and display the status bar with the text “Rendering” when displaying particularly long fields. For this reason, you may want to limit the size of sets and tuples that you render.
The Booleans Field Tab
You can use the Booleans field tab, shown in Figure 92, to change the appearance of boolean values. This tab provides a set of radio buttons allowing you to select the desired appearance.

Figure 92 The Booleans Field Tab
The Integers Field Tab
You can use the Integers field tab, shown in Figure 93, to change the appearance of integer values.
You can use the Width combo box to select the desired number of digits to be displayed. The setting ‘’Infer from value’’ indicates that the width of the displayed value should be as small as possible to properly represent the value.
The Style group box allows you to add common prefixes or suffixes to integer values, used to indicate the radix or base of the displayed number. Aion supports:
No prefix or suffix, e.g: ‘’75’’.
ANSI-C style prefixes, e.g: ‘’75’’, 0b1001100, or 0x4C.
Verilog style prefixes, e.g.: ‘’75’, ‘b1001100, or ‘h4C.
A subscript suffix indicating the base, e.g.: \(75 _ { 10 }\), or \(1001100 _ { 2}\), or \(4E _ { 16 }\).
The Base group box lets you select the base or radix to use for the displayed value. Aion supports displaying values in base 2, base 10, or base 16.
You can force hexidecimal digits to be displayed in upper case by checking the ‘’Use upper case for hexidecimal digits A through F and real exponent “E”’’ checkbox.
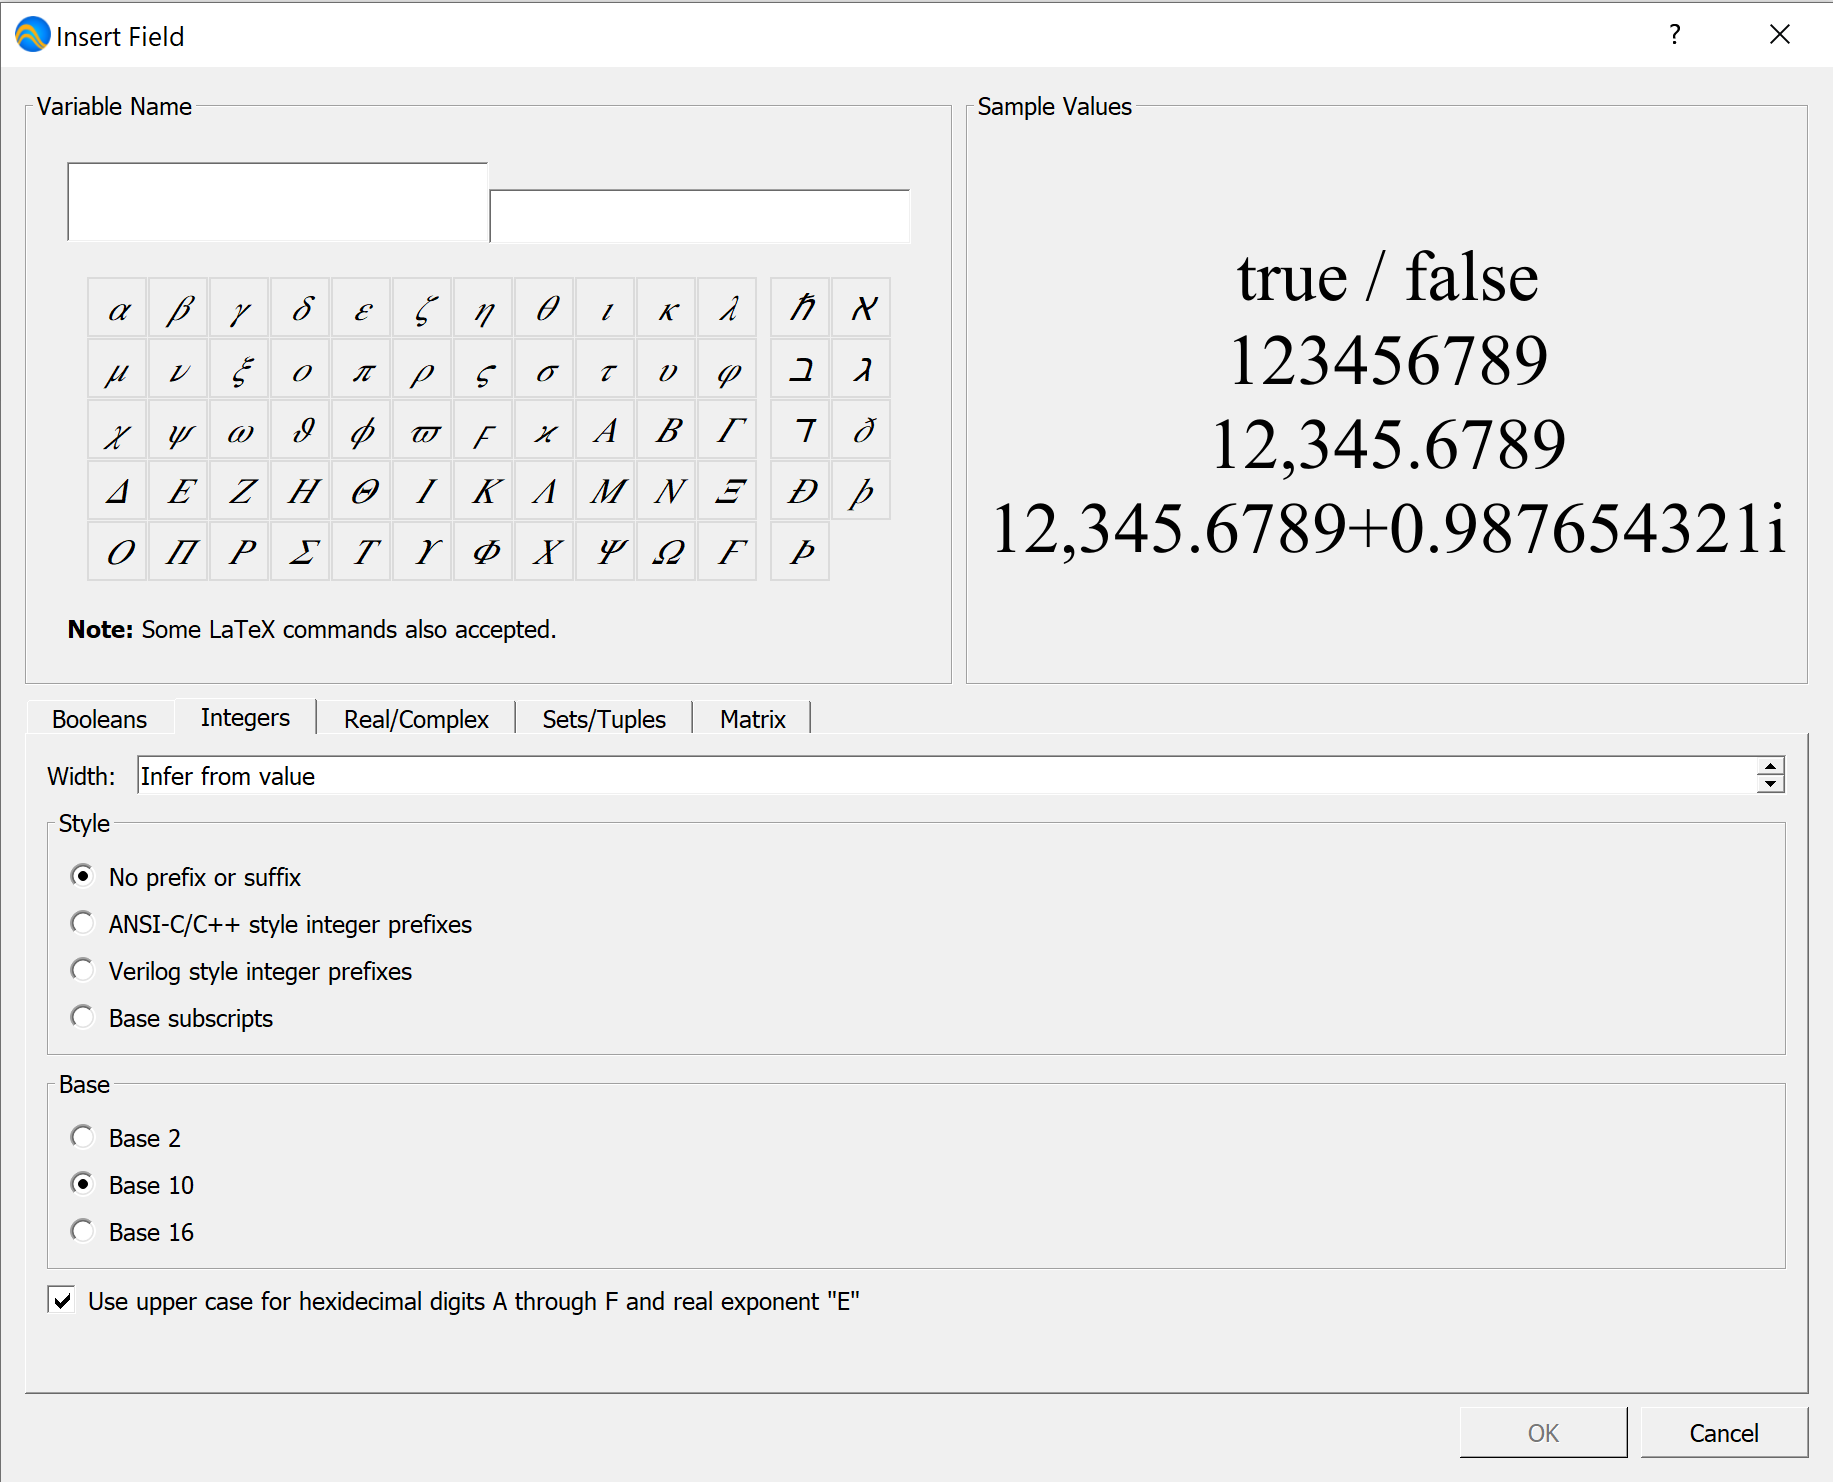
Figure 93 The Integers Field Tab
The Real/Complex Field Tab
You can use the Real/Complex field tab, shown in Figure 94 to change the appearance of real and complex values.
You can use the Precision combo box to set the precision, in this case, the number of digits to display after the decimal point. The setting ‘’Infer from value’’ indicates that Aion should select a reasonable precision value based on the number being displayed.
The Style group box allows you to select how real and complex values should be displayed.
Fixed point indicates that the number should be displayed as a simple sequence of digits, e.g.: ‘’-0.00012536’’.
Scientific notation indicates that the number should displayed using scientific notation, e.g.: \(-1.2536 \times 10 ^ {-4}\).
Engineering notation is similar to scientific notation except that the exponent will always be a multiple of 3, e.g.: \(-125.36 \times 10 ^ {-6}\).
Computer scientific notation will use the letter ‘’E’’ to indicate the exponent, e.g.: ‘’1.2536E-4’’.
The ‘’Most concise of…’’ options will select one of the options above based on which provides the most concise representation of the value.
The ‘’Imaginary Unit’’ group box allows you to select either ‘’i’’ or ‘’j’’ for imaginary numbers or the imaginary portion of complex numbers.
You can force the ‘’computer scientific representation’’ to use an upper-case ‘’E’’ by clicking on the ‘’Use upper case for hexidecimal digits A through F and real exponent “E”’’.
The Multipler field allows you to pre-multiply the values by an additional value. You can use this to adjust the displayed value should you want to display results in scaled units such as ‘’km’’ or ‘’miles’’ rather than ‘’meters’’.
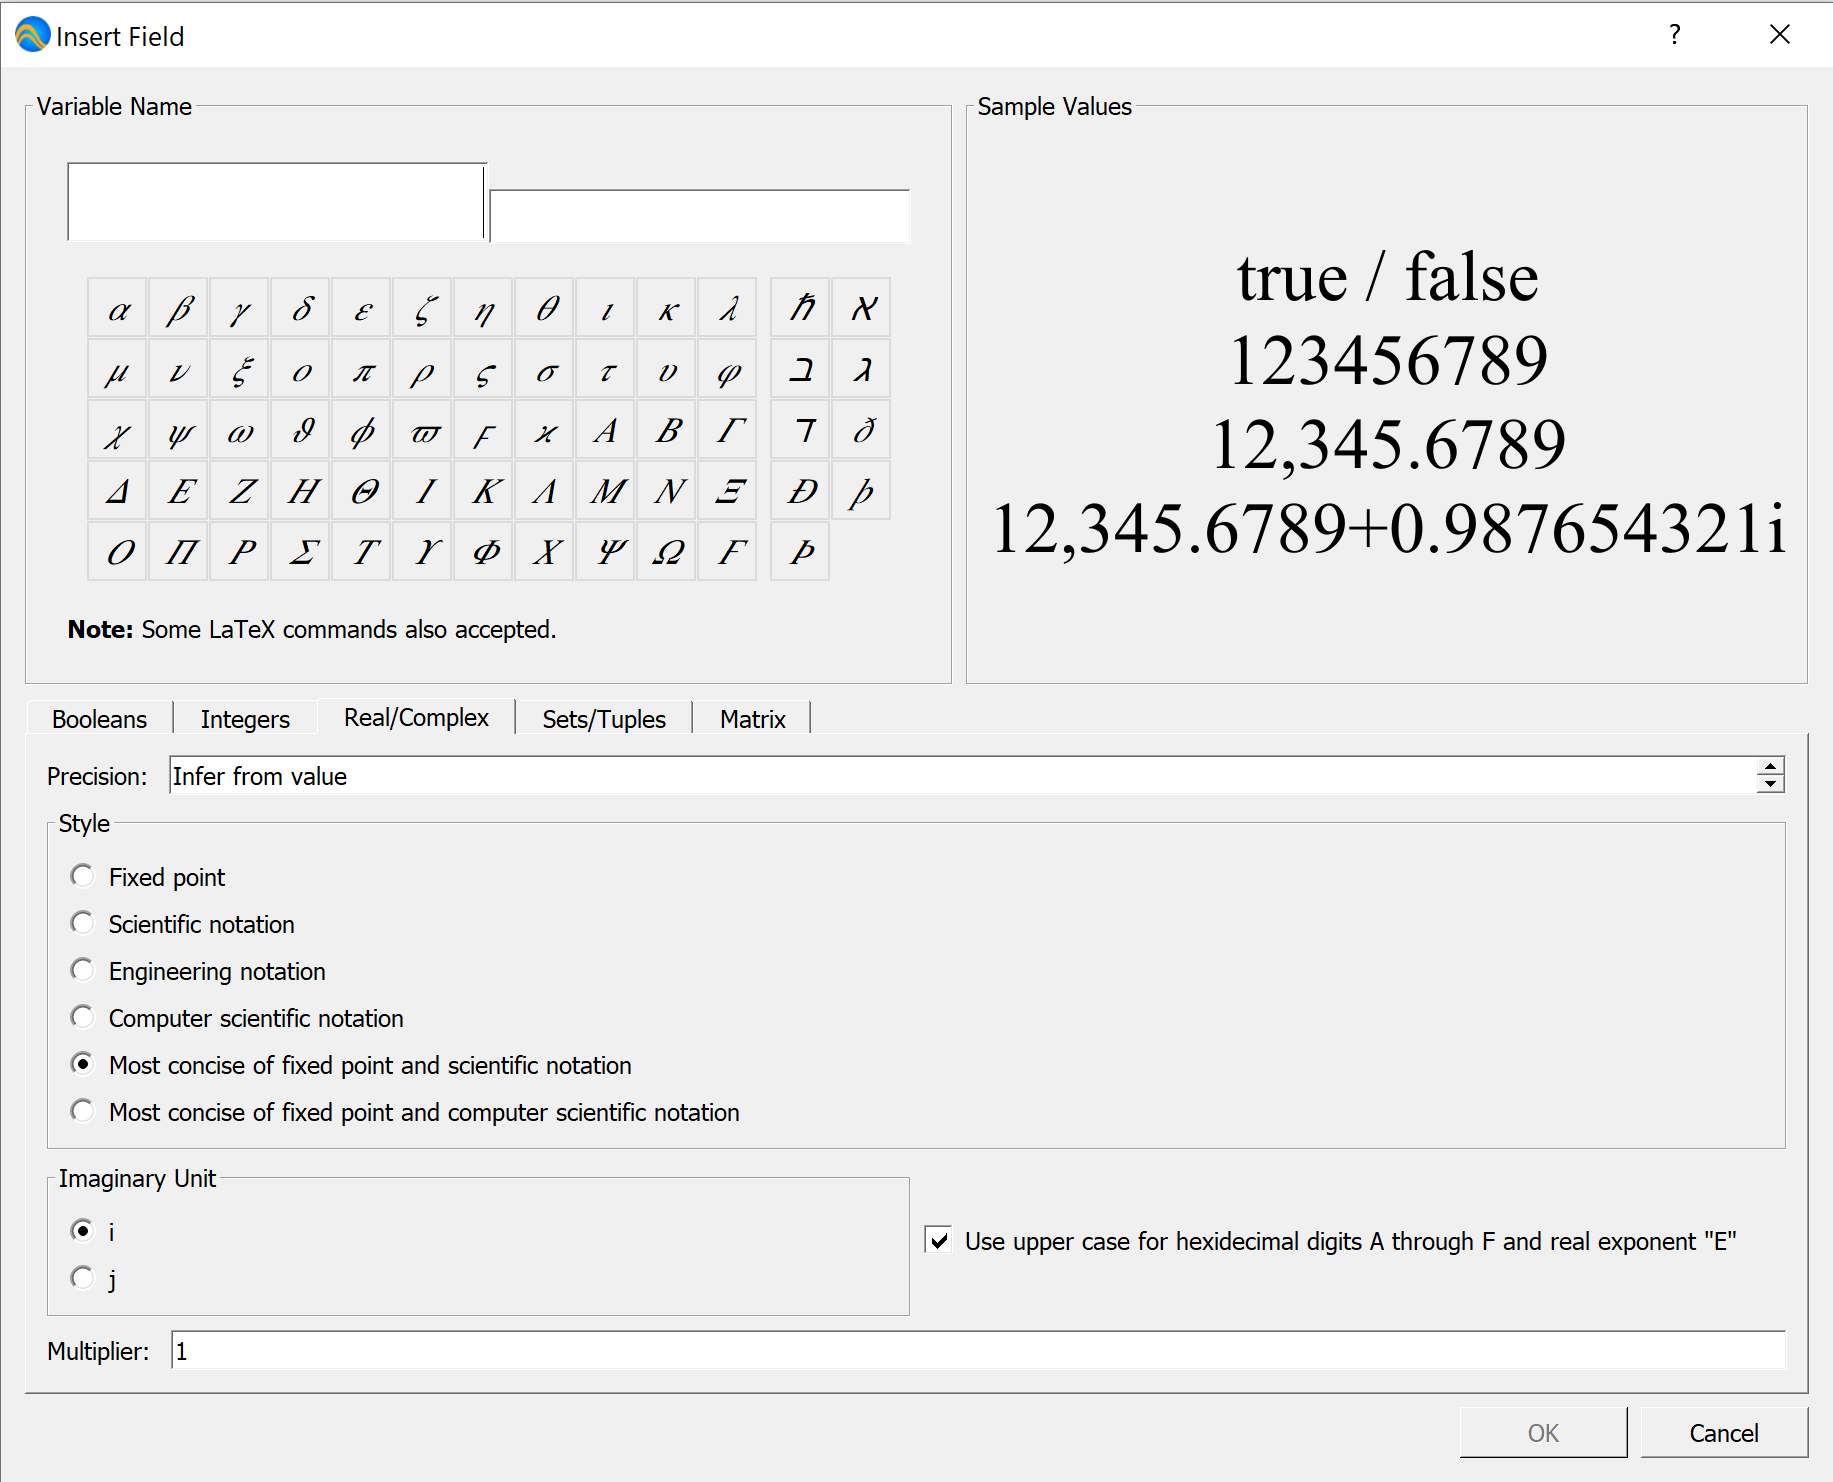
Figure 94 The Real/Complex Field Tab
The Sets/Tuples Field Tab
You can use the Sets/Tuples field tab, shown in Figure 95, to change the appearance of sets and tuples.
The Tuples displayed as: combo box can be used to select how tuples can be displayed. You can select:
‘’List of members’’ - In this case the tuple will be render each member independently using the current field settings as a comma separated list.
‘’String (unquoted)’’ indicates that the tuple should be rendered as a text string without quotes.
‘’String in angle brackets’’ indicates that the tuple should be rendered as a text string with surrounding angle brackets.
‘’Single quoted string’’ indicates that the tuple should be rendered as a text string with surrounding single quotes.
‘’Double quoted string’’ indicates that the tuple should be rendered as a text string with surrounding double quotes.
Note that this combo box does not impact the rendering of sets.
The Number leading members spin box allows you to specify the number of tuple or set members to show before displaying elipses. The special value ‘’Show all members’’ will cause the entire set or tuple to be displayed.
The Number trailing members spin box allows you to specify the number of tuple or set members to show after showing elipses. The displayed members will be the last entries in the set based on implicit ordering as described in Implicit Ordering, Sets, And Sorting or the last entries in the tuple.
The Show count of hidden members will cause the field to include a count of the number of set or tuple members that are not being shown. The count will be shown with the added elipses.
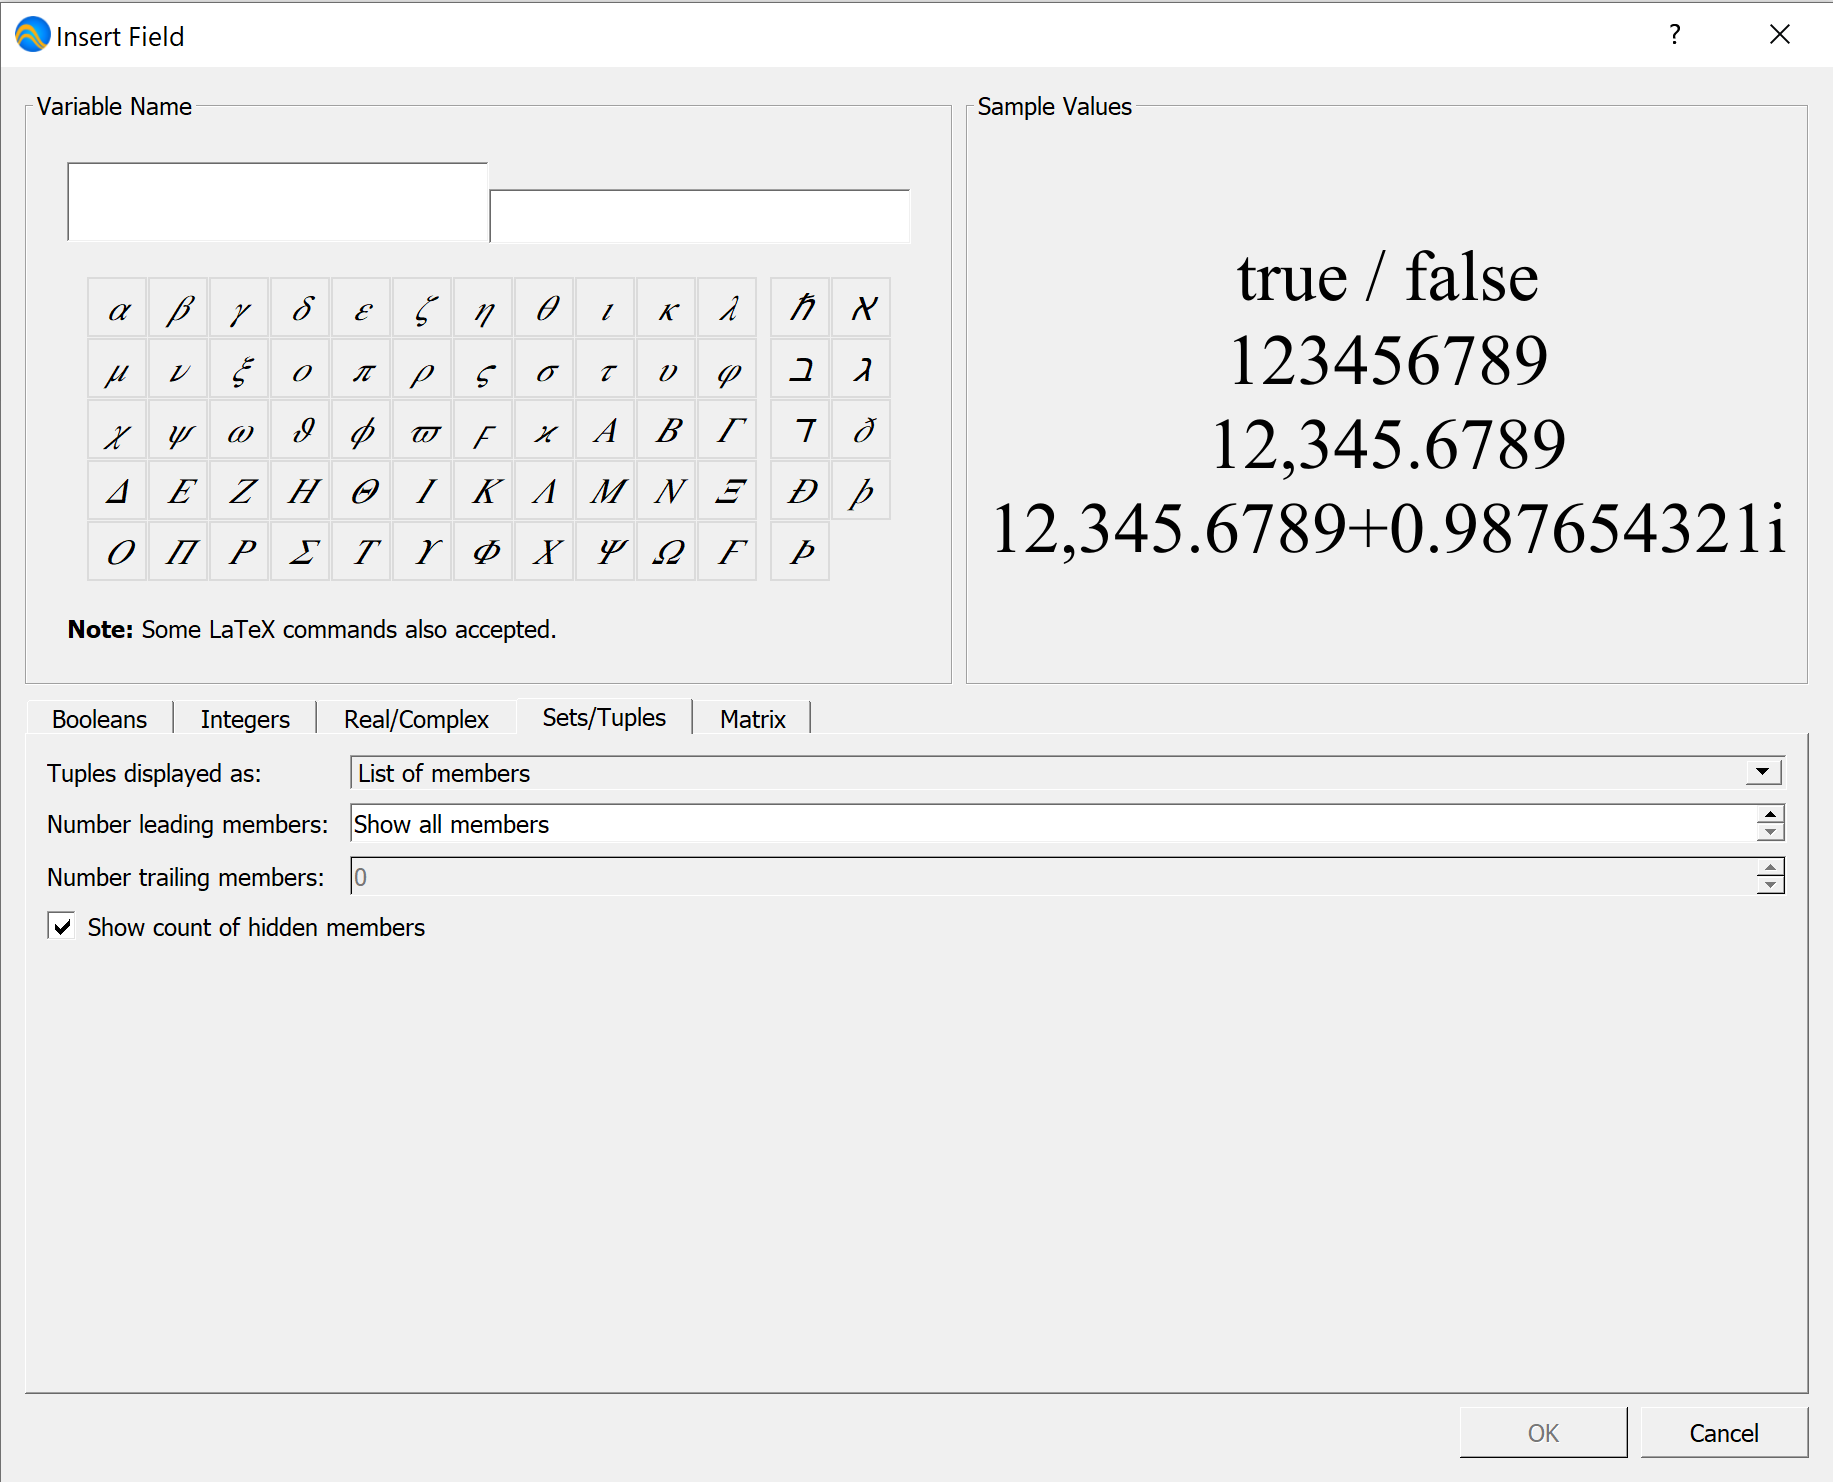
Figure 95 The Sets/Tuples Field Tab
The Matrix Field Tab
You can use the Matrix field tab, shown in Figure 96, to change the appearance of matrices.
The Rows group box allows you to set the number of leading and trailing rows to show for the matrix.
The Columns group box allows you to set the number of leading and trailing columns to show for the matrix.
When rows and/or columns are excluded, Aion will insert elipses.
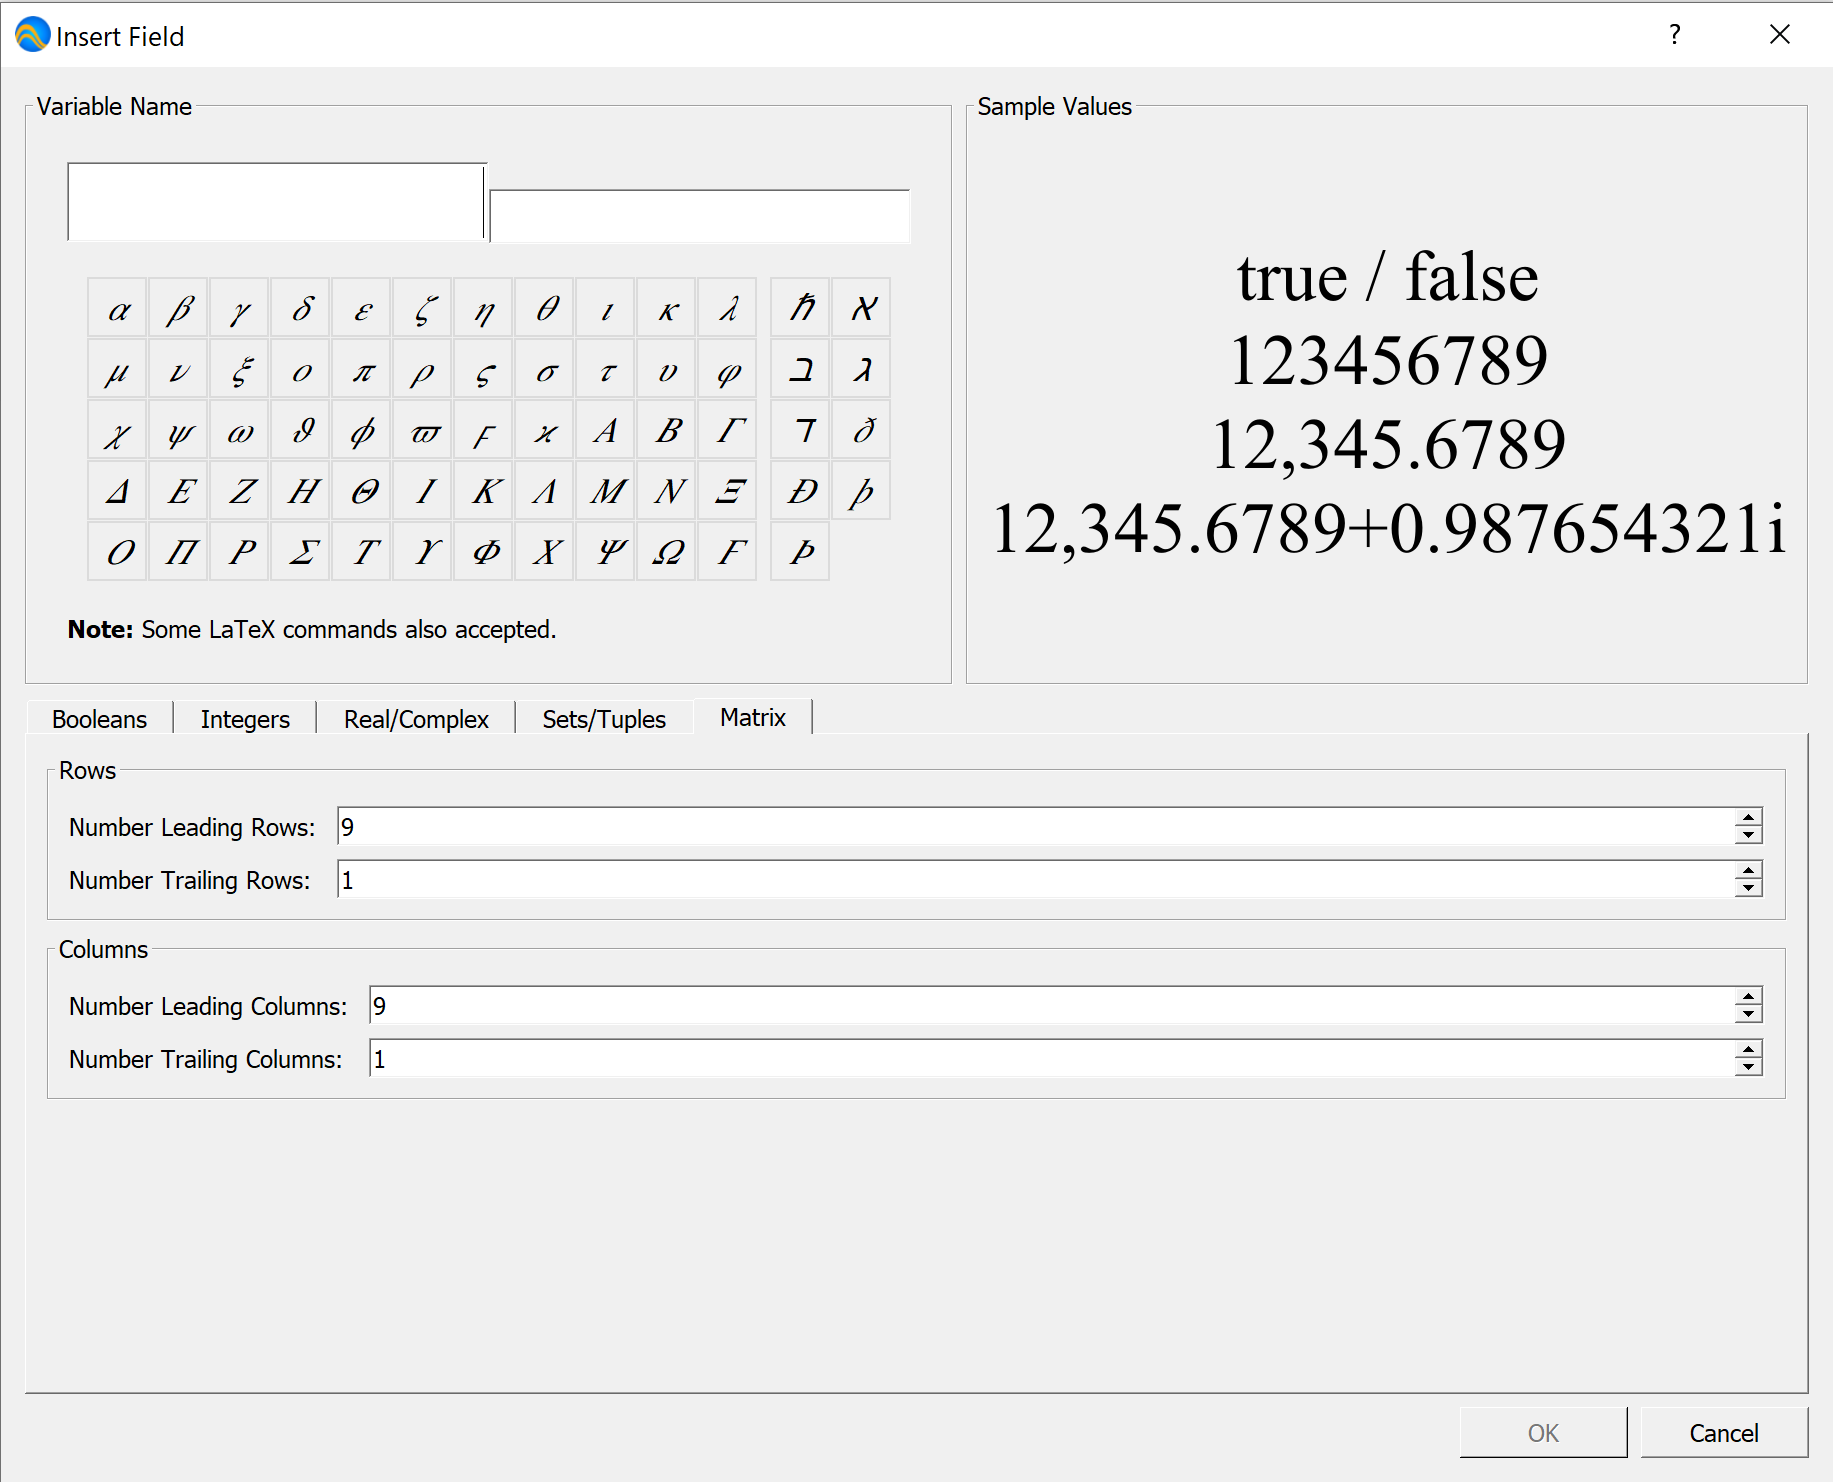
Figure 96 The Matrix Field Tab
Note
Matrices will self limit their displayed size to one page. If you need to display larger matrices, you can reduce the font size and/or increase the page size and orientation.
Plotting
You can insert plots and charts into your document. Like fields, plots are generated after your algorithm or model completes and can be placed anywhere within the document.
Plots behave a bit like images in that they can be placed in-line with text.
You insert a plot by clicking on the Insert Plot button,
 , on the Insert Dock, by selecting the Insert | Plot…
menu option, or by using the ‘’\insplt’’ backslash command. Performing any of
these actions will bring up the Insert Plot dialog, shown in
Figure 97.
, on the Insert Dock, by selecting the Insert | Plot…
menu option, or by using the ‘’\insplt’’ backslash command. Performing any of
these actions will bring up the Insert Plot dialog, shown in
Figure 97.
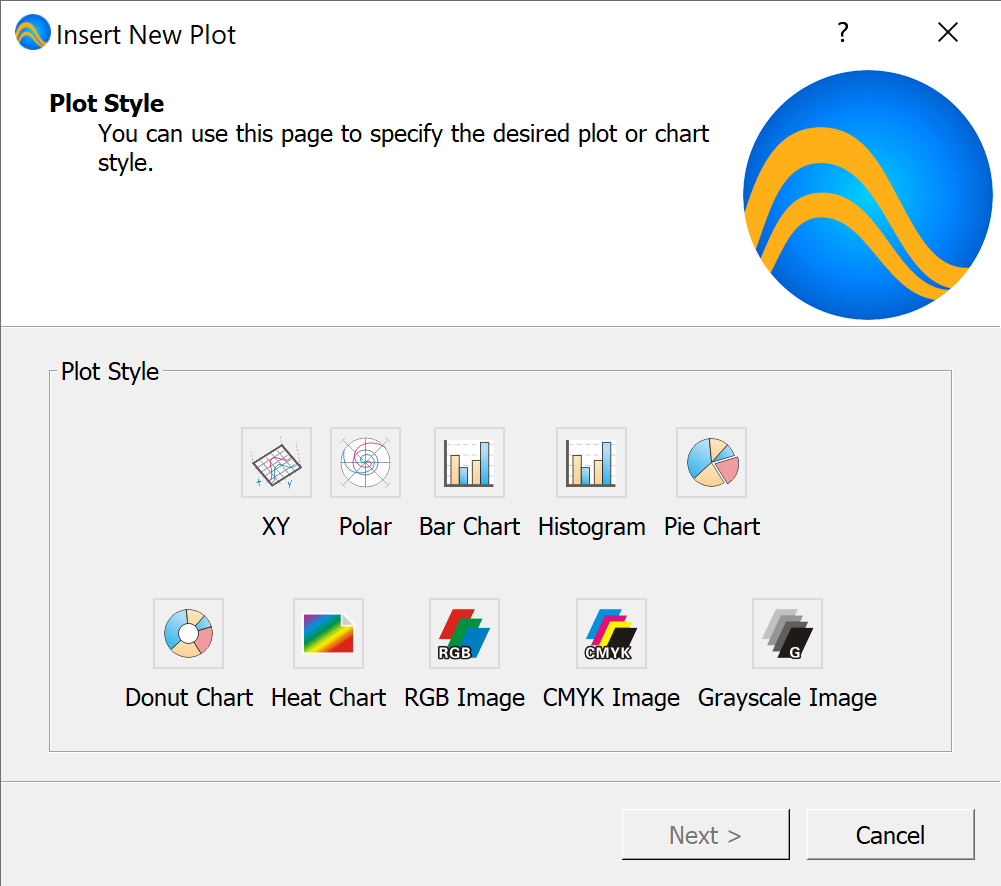
Figure 97 The Insert Plot Dialog
The Insert Plot dialog acts as a wizard, stepping you through the process of adding a new plot. The displayed wizard pages are similar for all types of plots.
You can modify an existing plot by selecting your plot, then selecting the Format | Plot… menu option or by using the ‘’\pltfmt’’ backslash command. The Format Plot dialog, shown in Figure 98 is similar to the Insert Plot dialog except that the controls are placed on tabs rather than on separate wizard pages.
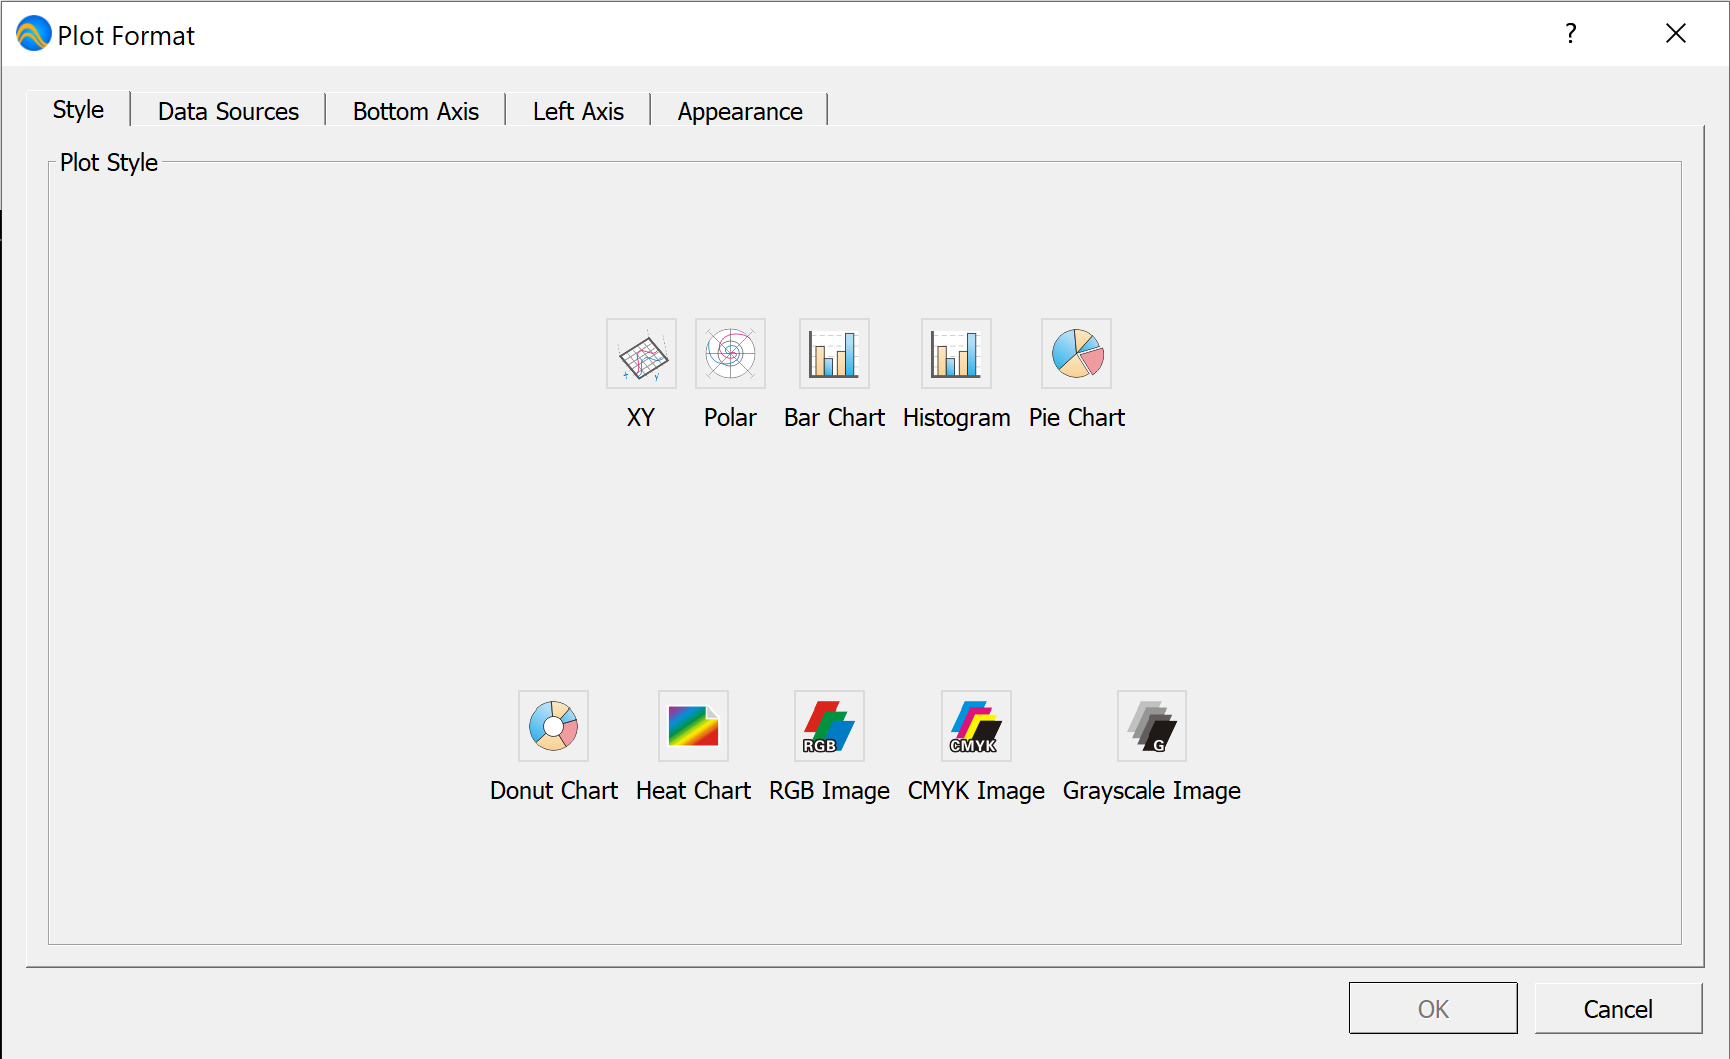
Figure 98 The Format Plot Dialog
You can use the first wizard page, shown in Figure 97, to select the type of plot you wish to display. Note that XY plots can be used to show traditional XY plots, scatter plots, splines, and linear regressions.
You can use the second wizard page, shown in Figure 99, to select the data sources for each data series. The number of data sources per data series will depend on the type of plot you select. For bar charts, pie charts, and donut charts, you can use the first data series to provide a tuple of strings naming the values across multiple data series. The appearance column will also change based on the capabilities and requirements for each type of plot.
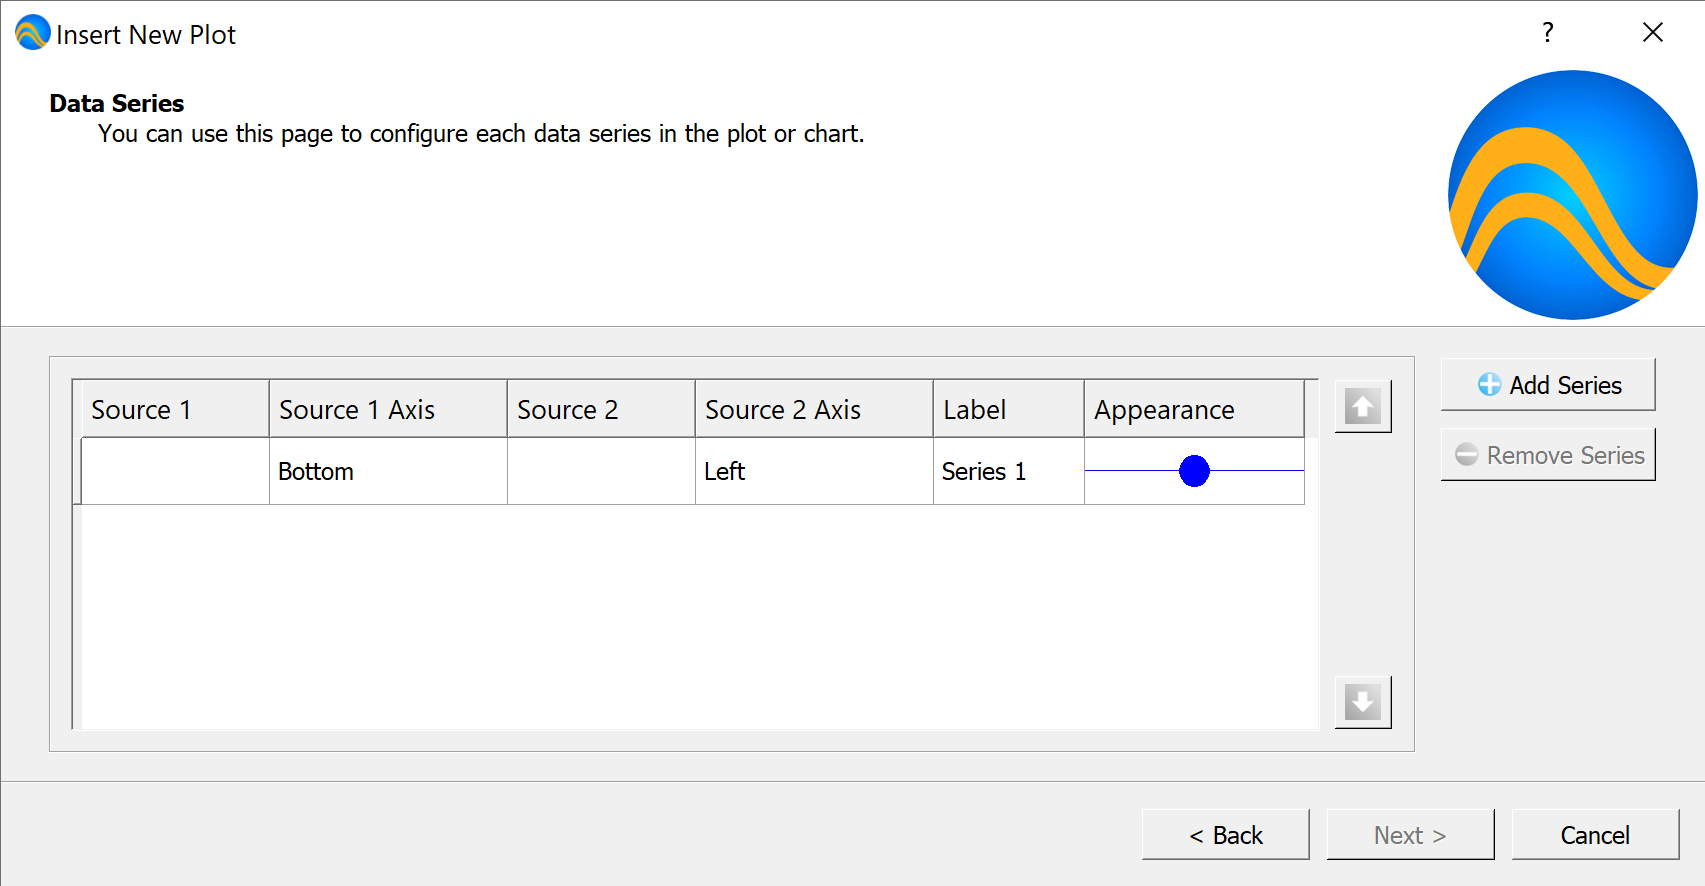
Figure 99 The Insert Plot Dialog, Series Page
You can add series by clicking on the Add Series button. You can remove a series by selecting it and clicking on the Remove Series button. If you double click on a series, you can modify the settings for that series.
When you add a series or modify the settings for a series, Aion will display the Plot Series dialog. You can use the Plot Series dialog, shown in Figure 100, to select the data sources for the plot series, set the label to apply for the plot series, and control how the plot series will be displayed in the plot. Note that the appearance and label settings as well as the number of data sources will vary based on type of plot and, in some cases, the series being added or modified.
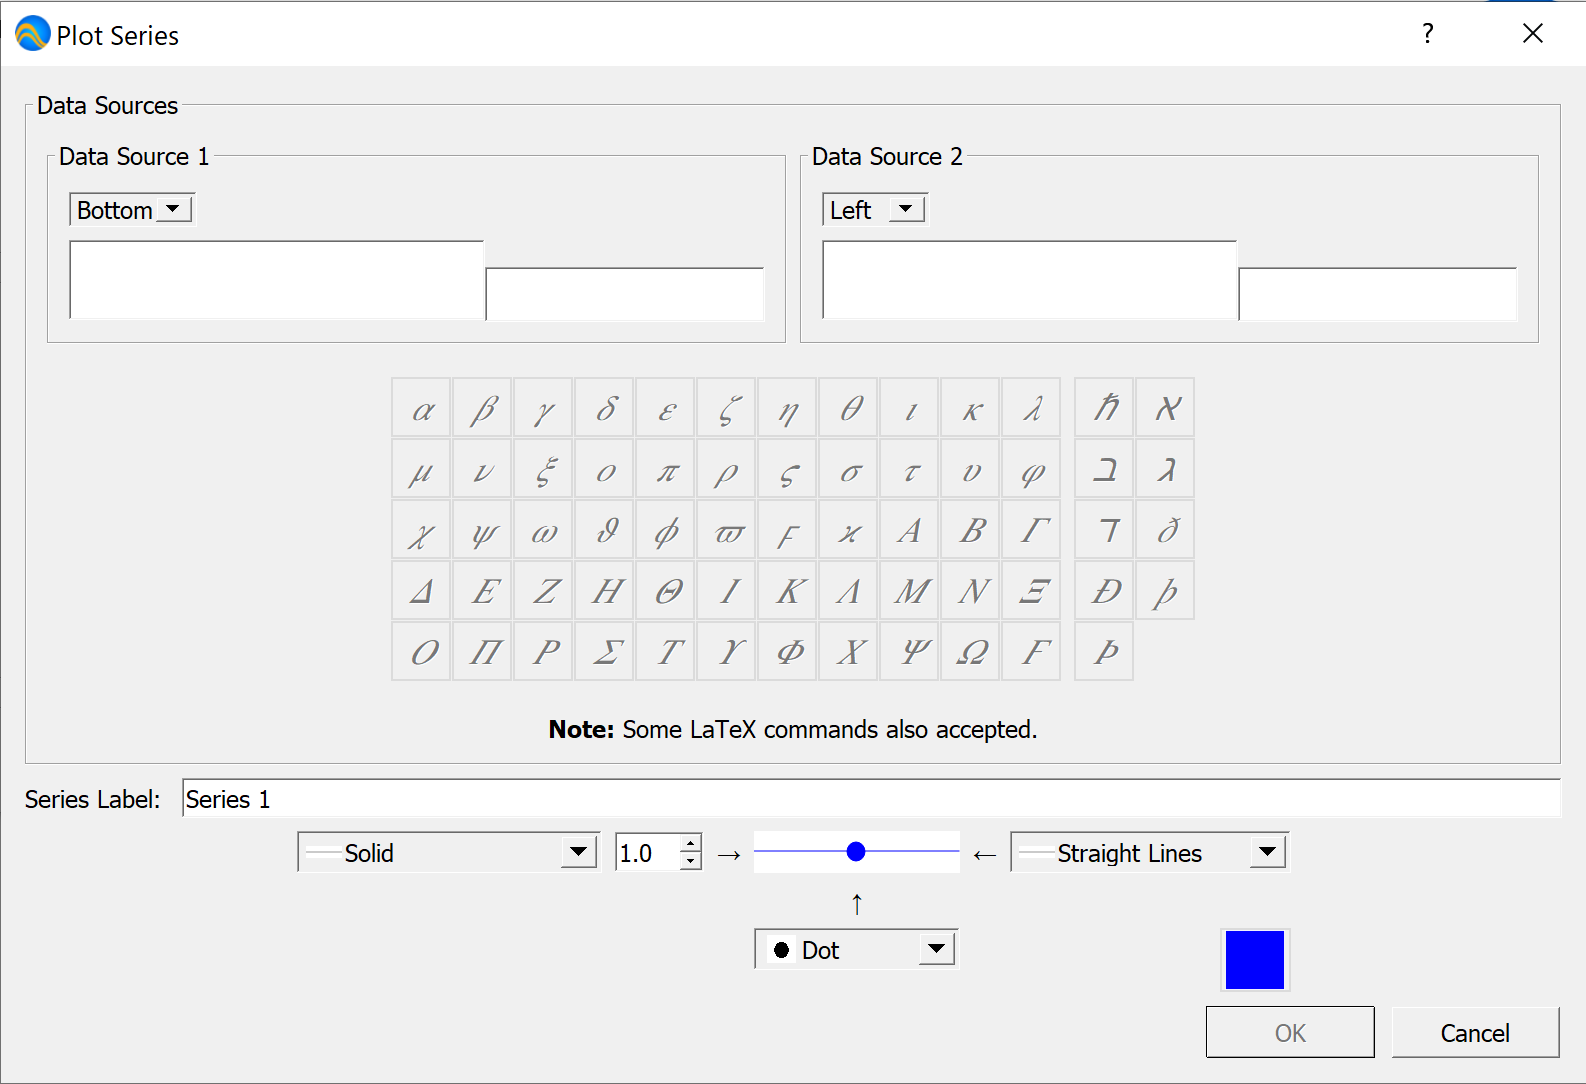
Figure 100 The Plot Series Dialog
The Insert Plot Dialog will then display between one and four pages allowing you to modify the settings for each axis, as shown in Figure 101. The axis settings pages allow you to set the type of scale used for each axis. Depending on the type of plot and and axis, you can select: Linear, Log 10 (Log Scale), 10 log 10 (db Scale), or 20 log 10 (db Scale).
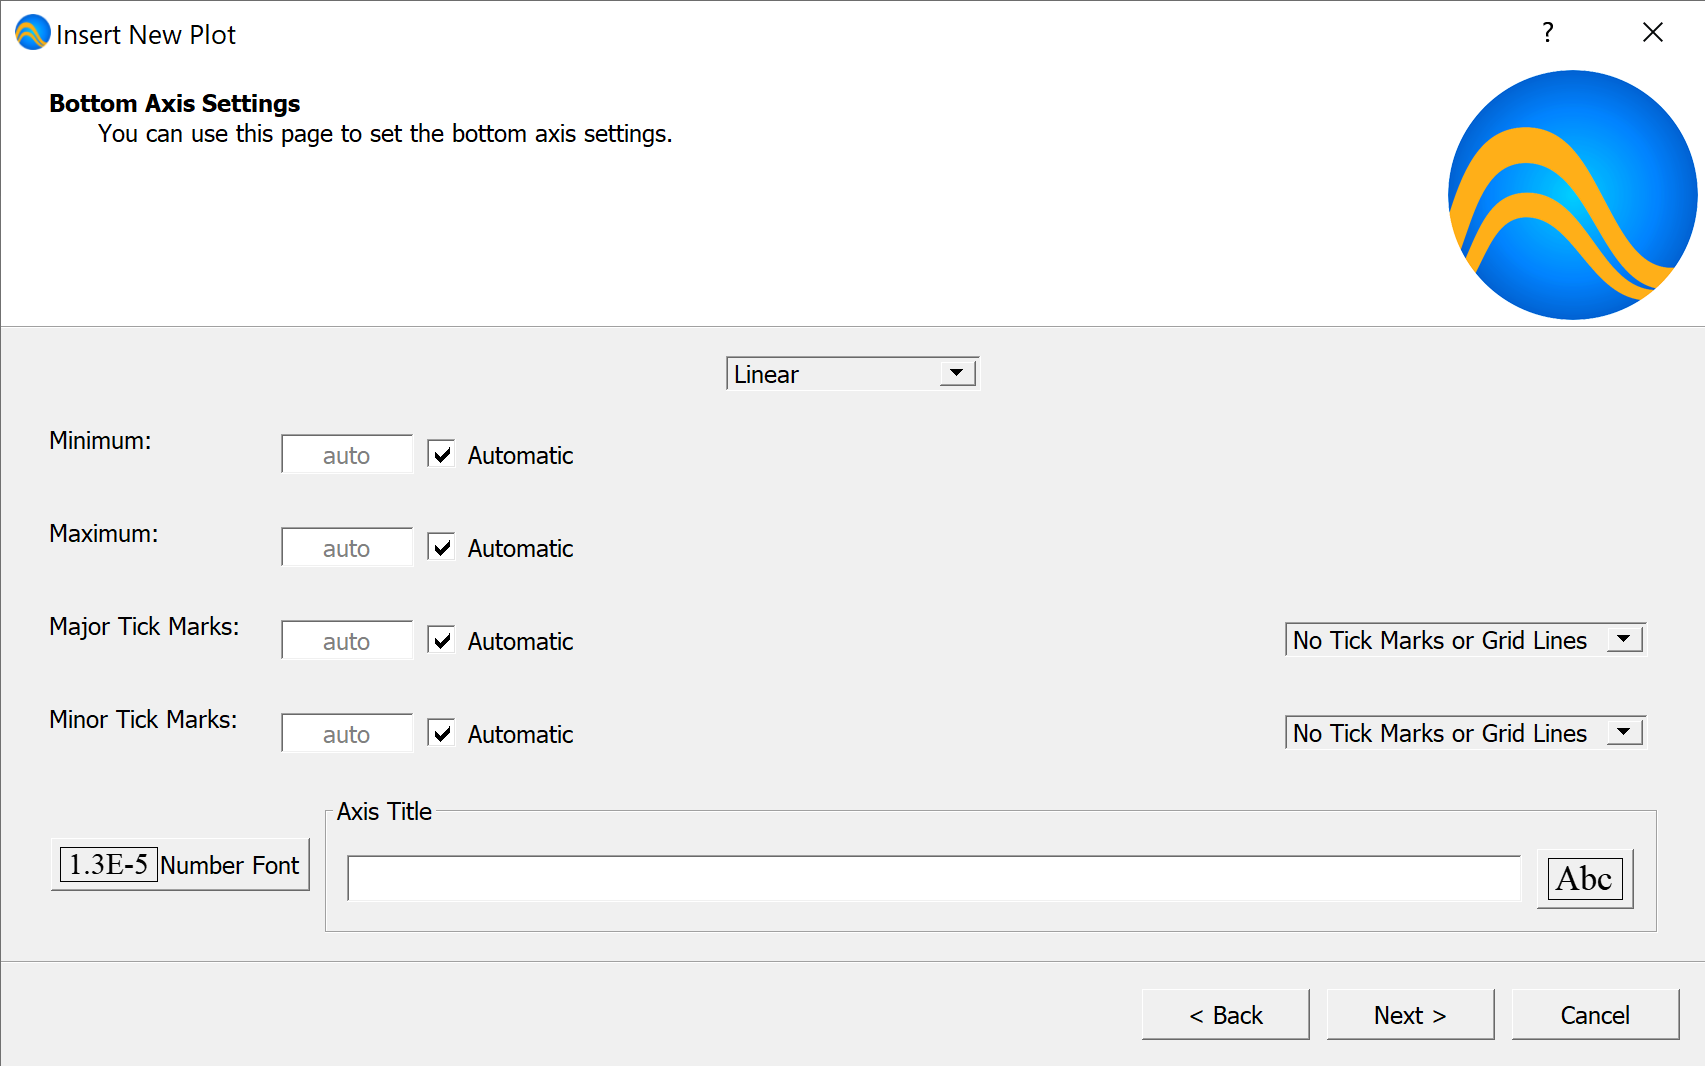
Figure 101 The Insert Plot Dialog, Example Axis Page
You can set the minimum and maximum values for the axis as well as the intervals to use for major and minor tick marks. Clicking on the ‘’Automatic’’ check box for any value will cause Aion to pick a reasonable value.
You can also select or modify the style of tick marks as well as grid lines tied to the major and minor tick marks. Lastly, you can change the number font, axis title, and axis title font as desired.
After configuring every axis, the Insert Plot Dialog will display the appearance page shown in Figure 102. You can use the appearance page to adjust the overall settings for the plot including the plot aize, the plot active area background color and border lines, the plot exterior border line color and outside background color. You can also control the appearance and location of the legend. Lastly, you can set the plot title text and font.
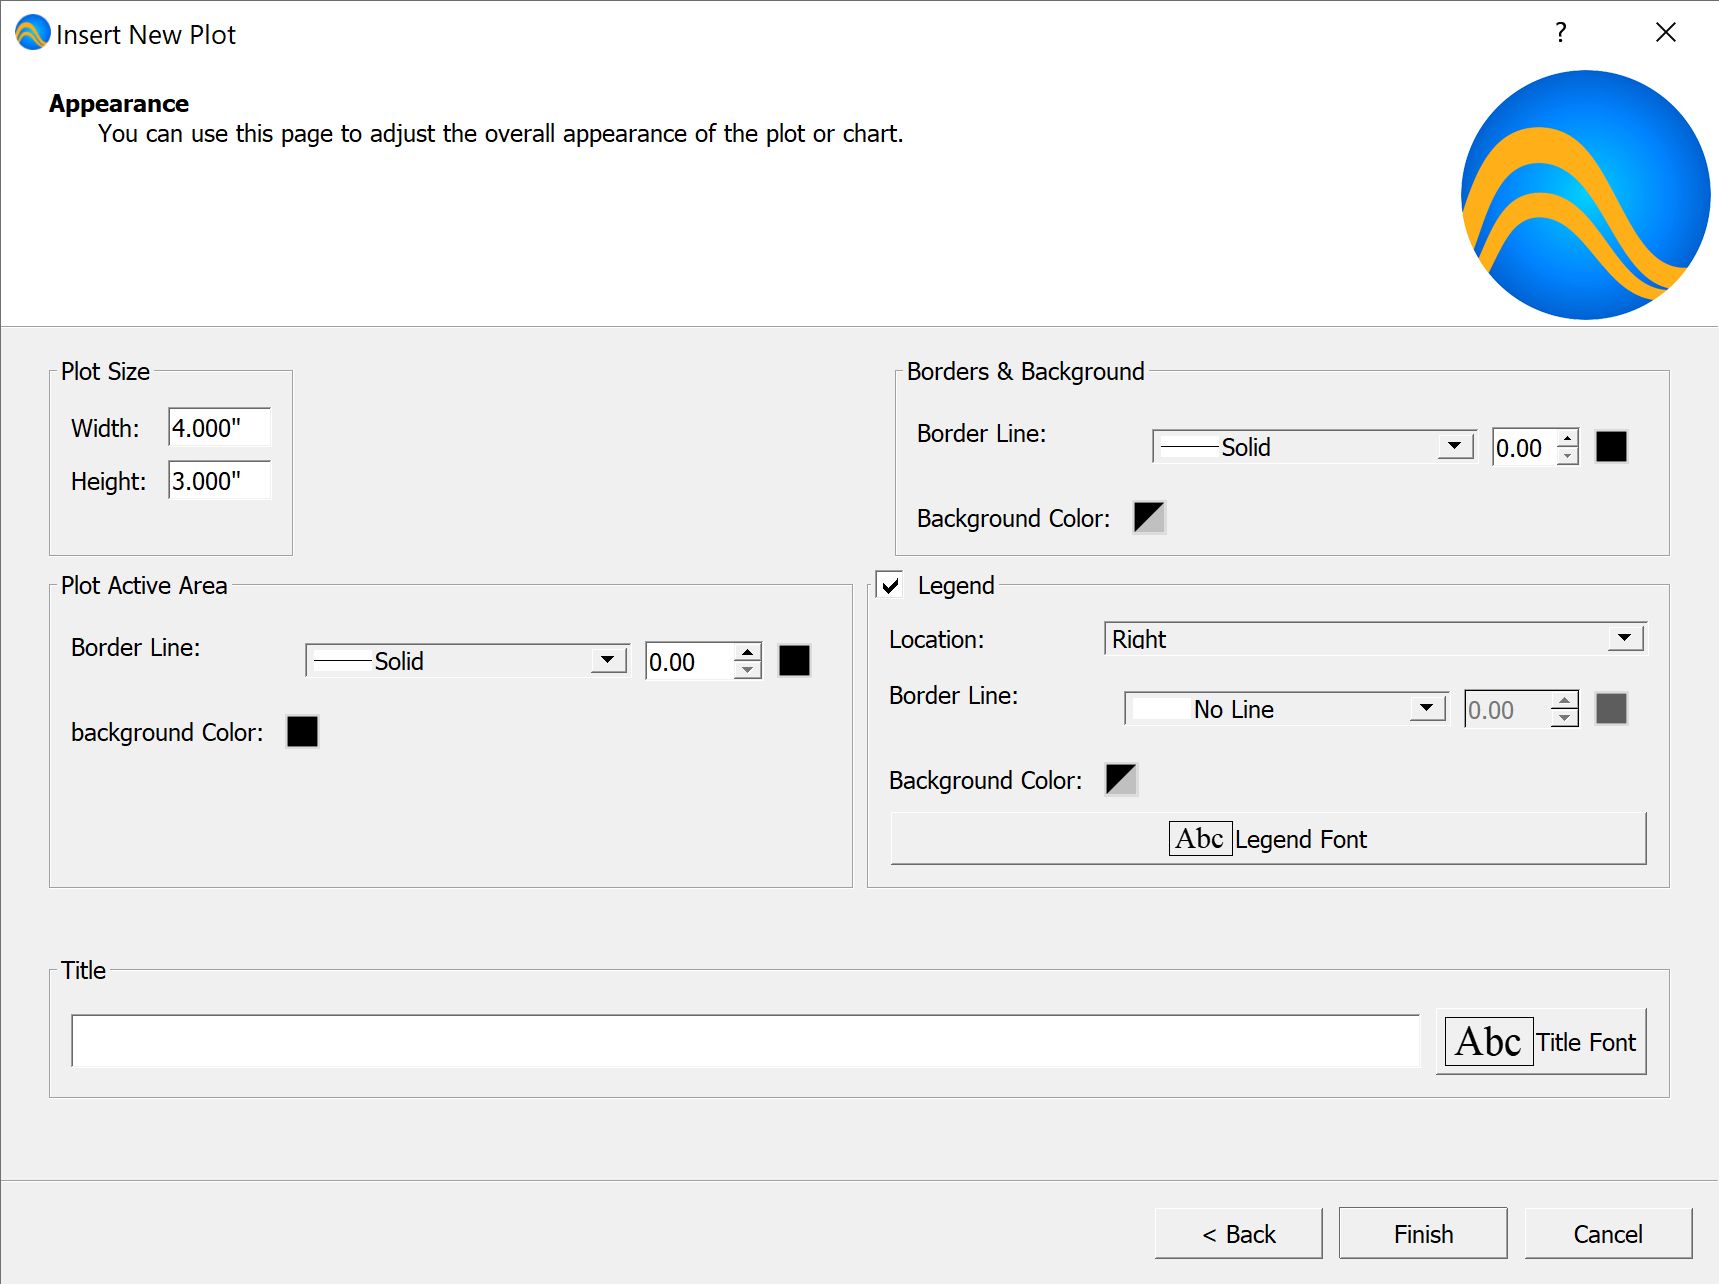
Figure 102 The Insert Plot Dialog, Appearance Page